Since state laws changed in 2016 to encourage the construction of accessory dwelling units, Los Angeles County has been at the forefront of the ADU construction frenzy.
One in five housing units built in 2022 was an ADU, according to a report by California YIMBY, an advocacy group.
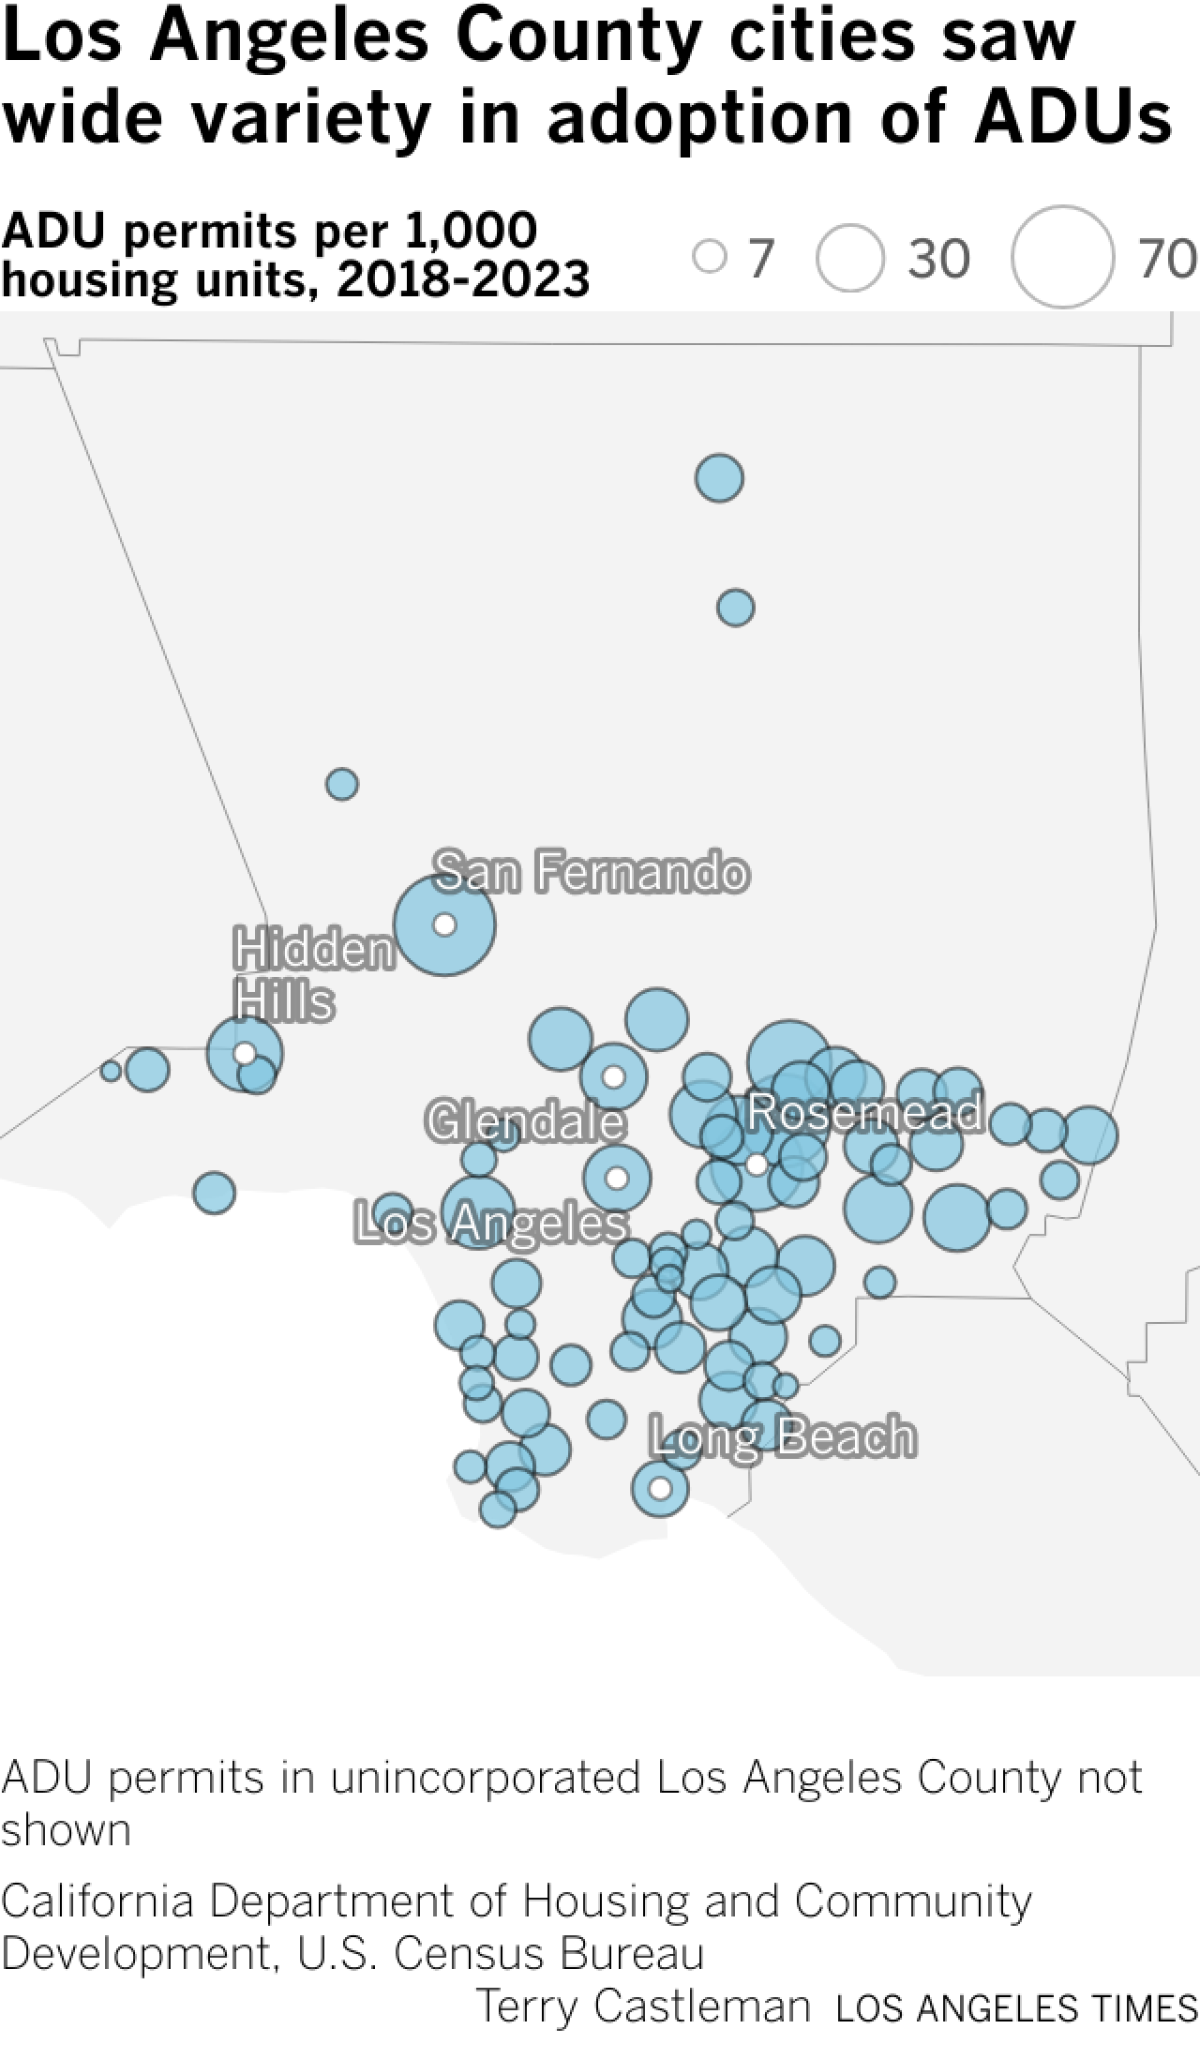
In Los Angeles County, permits have been unevenly distributed, with some cities approving many more ADU permits than others, a Times analysis of data from the California Department of Housing and Community Development showed.
Below is the complete list of cities and the number of ADU permits issued from 2018 through 2023 per 1,000 existing housing units.
| City | ADU permits per 1,000 housing units |
| 69.97 | |
| Rosemead | 56.84 |
| Temple City | 56.83 |
| Sierra Madre | 46.06 |
| Hidden Hills | 36.52 |
| Culver City | 34.46 |
| San Gabriel | 29.13 |
| La Puente | 28.71 |
| Los Angeles | 28.28 |
| Glendale | 27.85 |
| Walnut | 27.79 |
| South Pasadena | 27.77 |
| San Marino | 25.99 |
| Burbank | 24.28 |
| La Cañada Flintridge | 23.82 |
| Monrovia | 21.88 |
| Whittier | 21.49 |
| Pico Rivera | 21.41 |
| Lynwood | 21.02 |
| Lakewood | 19.78 |
| Arcadia | 19.78 |
| Norwalk | 19.59 |
| Claremont | 19.54 |
| Bell Gardens | 19.35 |
| Santa Fe Springs | 19.12 |
| Long Beach | 18.67 |
| Downey | 18.31 |
| Baldwin Park | 17.18 |
| Duarte | 16.63 |
| Covina | 16.36 |
| Lomita | 14.97 |
| Hawaiian Gardens | 14.89 |
| Paramount | 14.56 |
| South El Monte | 14.23 |
| Azusa | 14.02 |
| Rolling Hills Estates | 13.84 |
| Bellflower | 13.60 |
| El Segundo | 13.56 |
| Inglewood | 13.54 |
| Glendora | 13.05 |
| Pasadena | 12.83 |
| Torrance | 12.73 |
| El Monte | 12.41 |
| Lancaster | 12.28 |
| Lawndale | 11.04 |
| Monterey Park | 10.62 |
| Agoura Hills | 9.97 |
| Rolling Hills | 9.97 |
| South Gate | 9.88 |
| Alhambra | 9.82 |
| La Verne | 9.81 |
| San Dimas | 9.07 |
| Malibu | 9.00 |
| West Covina | 8.56 |
| Gardena | 8.55 |
| Diamond Bar | 8.26 |
| Santa Monica | 8.18 |
| Signal Hill | 7.94 |
| Huntington Park | 7.70 |
| Carson | 7.54 |
| Compton | 7.46 |
| Pomona | 7.37 |
| Redondo Beach | 7.29 |
| Maywood | 7.28 |
| Calabasas | 7.23 |
| Montebello | 7.18 |
| Artesia | 7.10 |
| Palmdale | 6.51 |
| Rancho Palos Verdes | 6.40 |
| Beverly Hills | 6.06 |
| Manhattan Beach | 5.94 |
| Bell | 5.66 |
| Hermosa Beach | 5.46 |
| West Hollywood | 5.07 |
| Palos Verdes Estates | 4.70 |
| La Habra Heights | 4.44 |
| Santa Clarita | 4.38 |
| La Mirada | 4.24 |
| Hawthorne | 3.78 |
| Commerce | 3.64 |
| Cudahy | 2.88 |
| Cerritos | 2.38 |
| Westlake Village | 1.16 |
The map below shows all the cities together: